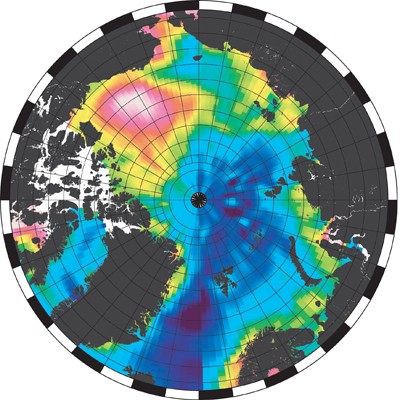
A plot of the Arctic sea surface height
Scientists at UCL have produced the most extensive map of Arctic sea-ice thickness yet using just two months' worth of data from the European Space Agency's ice mission, CryoSat-2. Data from the satellite has also helped them create an updated map of ocean circulation in the Arctic, and a topographical relief map of Antarctica. All three maps demonstrate that CryoSat-2 is working well and, in some cases, is exceeding expectations. 'This is the first time we've been able to measure sea-ice thickness over almost the entire Arctic ice pack,' says Dr Seymour Laxon, director of the Centre for Polar Observation and Modelling (CPOM) at UCL. 'The map shows clear agreement with data gathered from aircraft during a recent Arctic campaign, showing that CryoSat-2 can accurately measure changes in ice thickness.' 'We can't yet say anything about changes - for that you need a longer dataset,' he adds. The sea-ice thickness map is based on data from January and February 2011 and shows thicker, rough, multi-year ice - which has survived last summer's melt - north of Canada and Greenland, stretching to the North Pole and slightly beyond. Elsewhere in the Arctic the map reveals thinner, first year ice, and corresponds well with maps produced by other researchers.
TO READ THIS ARTICLE, CREATE YOUR ACCOUNT
And extend your reading, free of charge and with no commitment.